Rotating Drum Disks
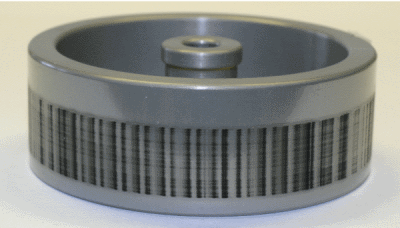
Photo: A six-week continuous DRUM sample of particles between 0.09 and .26 um. (Our DA800 DRUM sample has 8 drum disks that operate simultaneously, each disk calibrated to specific particle sizes)
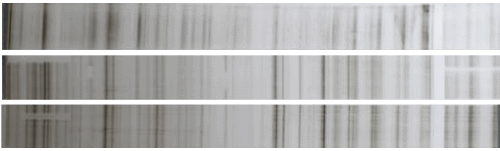
Particle deposition on three rotating drum disks deposited on Mylar substrate. Particles have been separated by size such that the Mylar strips have the following particle sizes.
- Strip A (top) 2.5 - 1.15 microns
- Strip B (middle) 0.34 to 1.15 microns
- Strip C (bottom) 0.15 to 0.34 microns
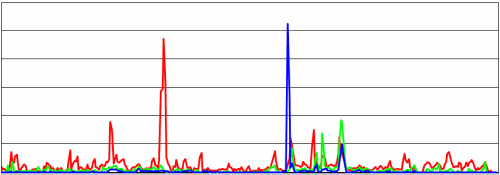
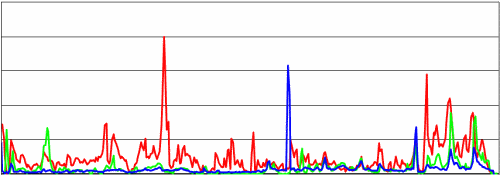
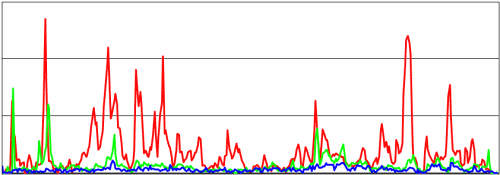
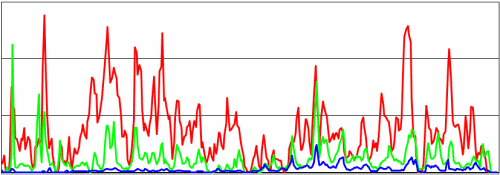
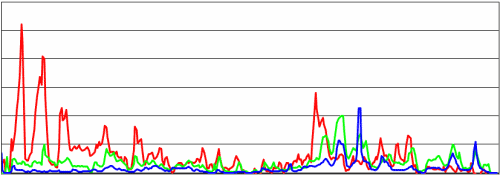
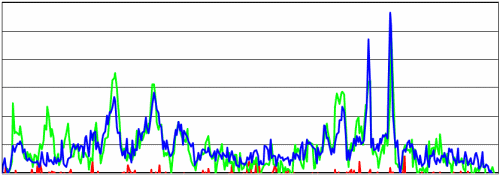
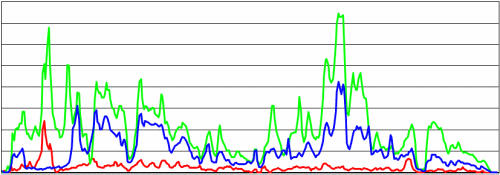
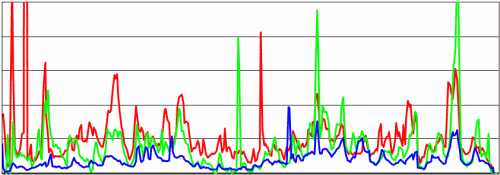
The line plot shows elemental concentrations for 9 elements for the three different strips over 6-weeks. Click on the element name to see the concentrations for each element. Notice that some elements like Lead and Iron track together. Also notice that some peaks are from large particles (Strip A, which indicate friction sources) while other peaks are from small particles (Strip C which indicate high-temperature combustion sources).
Strip A (top) 2.5 - 1.15 microns
Strip B (middle) 0.34 to 1.15 microns
Strip C (bottom) 0.15 to 0.34 microns
Strip A (top) 2.5 - 1.15 microns
Strip B (middle) 0.34 to 1.15 microns
Strip C (bottom) 0.15 to 0.34 microns
Strip A (top) 2.5 - 1.15 microns
Strip B (middle) 0.34 to 1.15 microns
Strip C (bottom) 0.15 to 0.34 microns
Strip A (top) 2.5 - 1.15 microns
Strip B (middle) 0.34 to 1.15 microns
Strip C (bottom) 0.15 to 0.34 microns
Strip A (top) 2.5 - 1.15 microns
Strip B (middle) 0.34 to 1.15 microns
Strip C (bottom) 0.15 to 0.34 microns
Strip A (top) 2.5 - 1.15 microns
Strip B (middle) 0.34 to 1.15 microns
Strip C (bottom) 0.15 to 0.34 microns
Strip A (top) 2.5 - 1.15 microns
Strip B (middle) 0.34 to 1.15 microns
Strip C (bottom) 0.15 to 0.34 microns
Strip A (top) 2.5 - 1.15 microns
Strip B (middle) 0.34 to 1.15 microns
Strip C (bottom) 0.15 to 0.34 microns
Strip A (top) 2.5 - 1.15 microns
Strip B (middle) 0.34 to 1.15 microns
Strip C (bottom) 0.15 to 0.34 microns